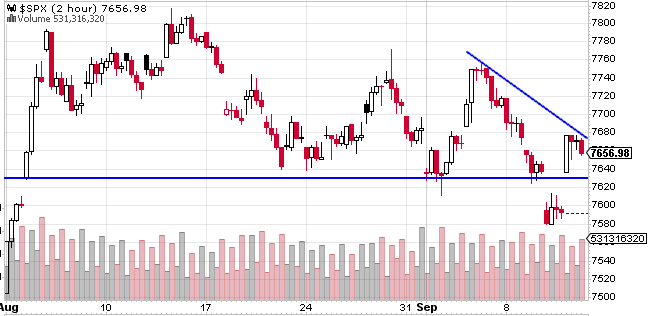
The market ended the week on a positive, but failed to hold the highs of the day. Near term support sits at the 7630 level. The 2-hour chart below does a good job of showing that. I normally like to use 1-hour charts, but the market has been stuck in a range for too long and the 1-hour chart does not show it all.
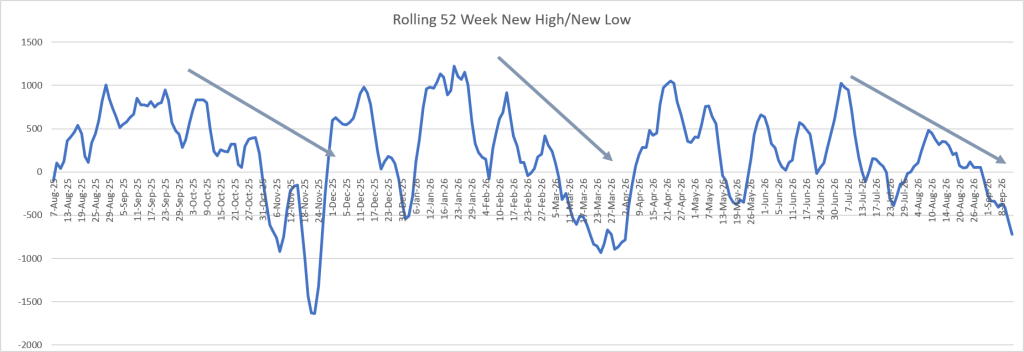
The rolling 52-week NHNL is now negative. Given the seasonal weakness and what has been going on in the bond market, we are not likely looking at a resumption of the upward trend in the near term. The Fed is also looming large this week with a rate increase looking likely. Not a lot of bullish catalysts there. The news is important, but I gave up believing I can outthink everyone else and will just wait for the market to decide what happens next.
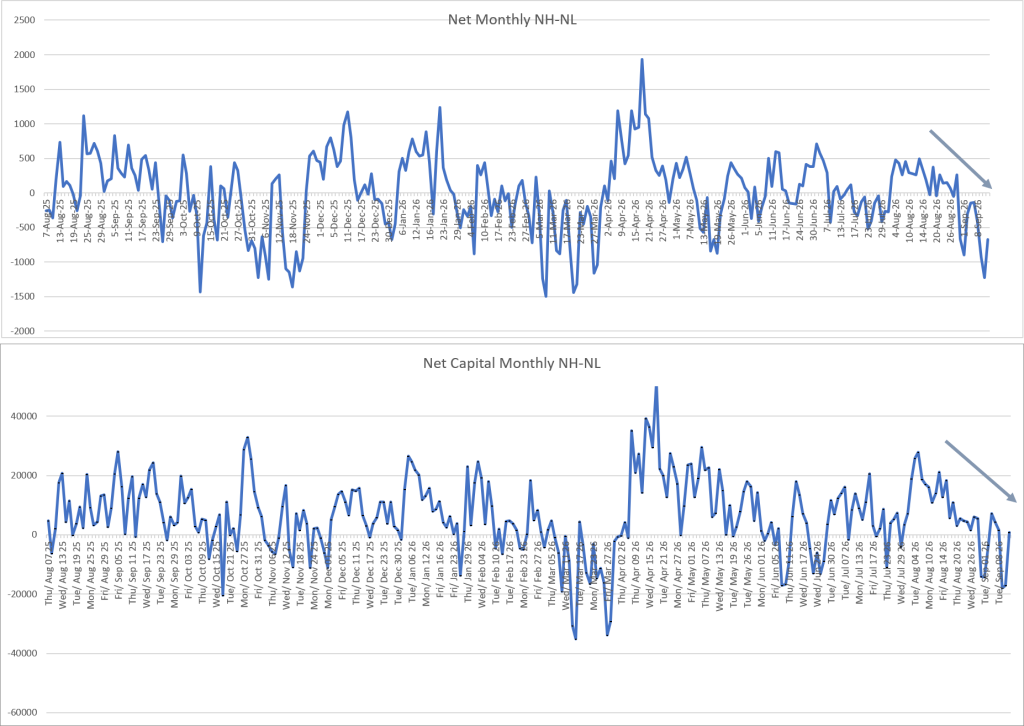
The monthly NHNL and Capitalized NHNL are also negative. They reversed a little on Friday, but it looks like it was blowing off steam more than reversing.
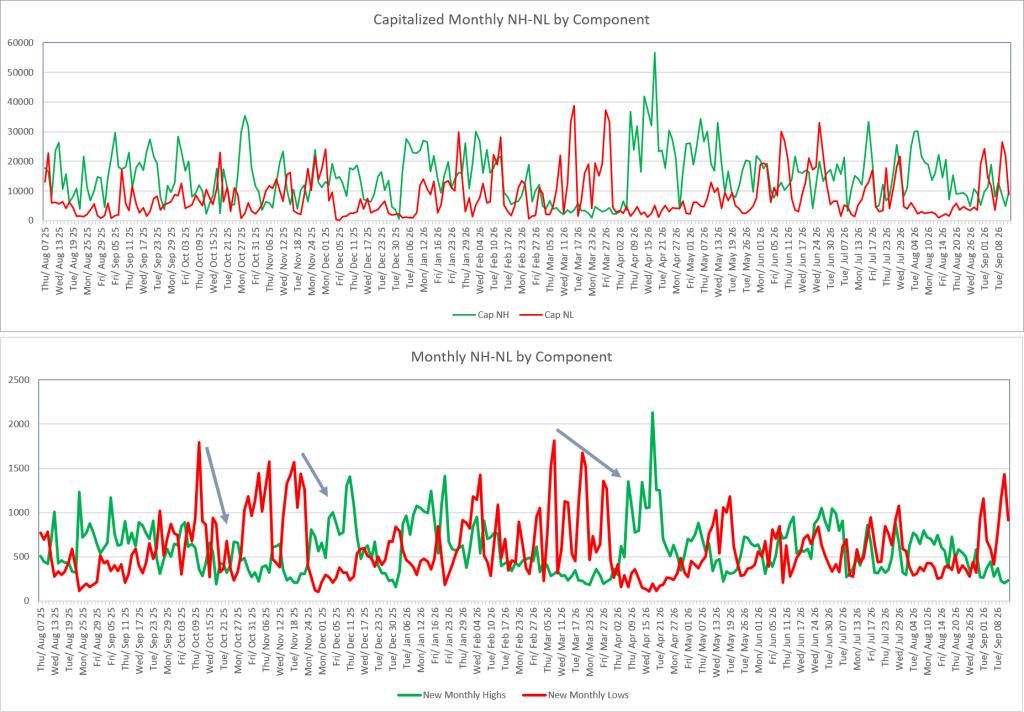
When you look at the individual components, it is likely a downward slide needs to happen a little more. Neither of them have peaked to levels where recent reversals have happened. The monthly NHNL normally sees a couple negative spikes of decreasing strength before a bottom is found. The capitalized NHNL should exceed 30 Trillion and it has not done that yet.
I have been playing around with AI to create a market conditions dashboard with mixed luck. It is starting to take shape. It has been a fun project when I have a couple minutes here and there. It is not done yet, but I should have a better working version over the next few weeks. I am using data going back to 2000 for the AI to build the model. The biggest problem so far is it is not responsive enough. I have not found either the right indicators or the best mix of the indicators for the project.

