On the hourly chart, the S&P 500 has broken it’s range it is played in since the end of August. It tested the waters on Thursday and Friday of trying to go lower and failed both times. It is looking like the bulls are starting to take over again.
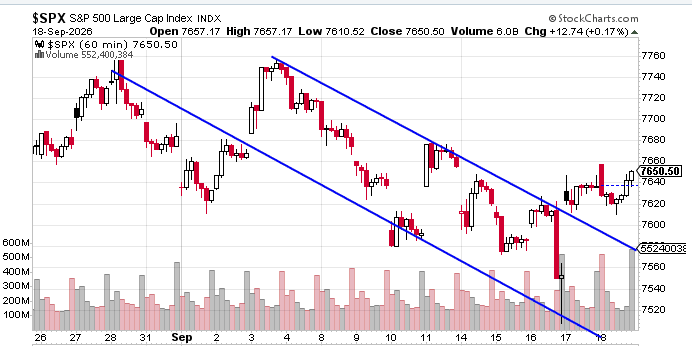
The market broke below the 7630 level and finished the week above it. For the moment, support is holding.

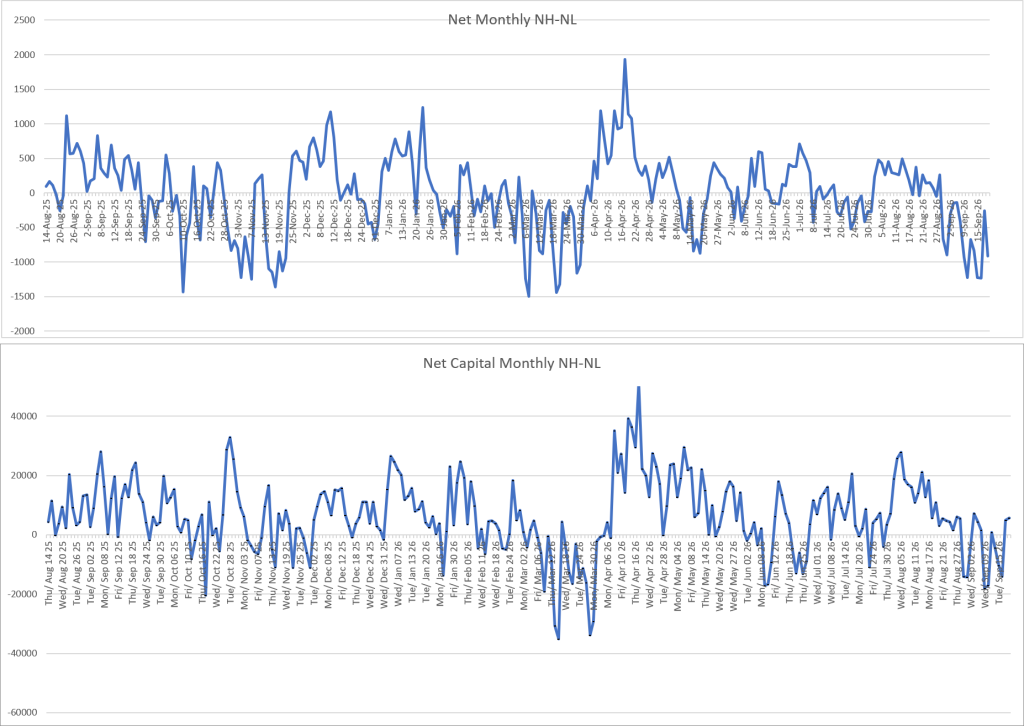
Net Capitialzied NHNL and the Monthly NHNL are both bottoming and reversing. That is also bullish.
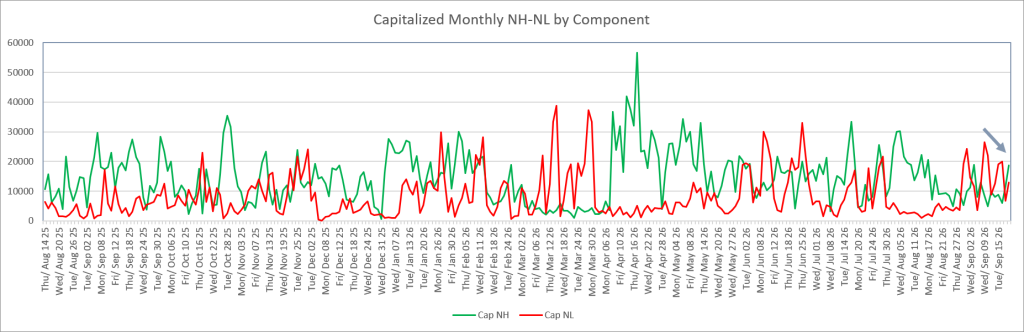
By components, the capitalized new monthly lows did not go above 30 trillion, which would make what appears to be a resumption of the uptrend more convincing. However, it did get close and is declining.
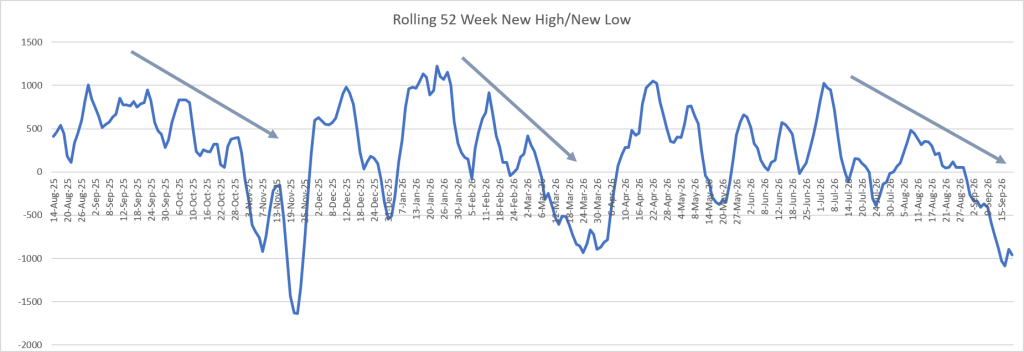
The rolling 52-week NHNL also appears to be bottoming and starting to show signs that the market is poised to resume going upward.
It looks like the uptrend is going to resume and I did go long towards the end of last week. Not fully in the market yet, but building positions.
I am now paper testing the new model I created. It defines the current market conditions and then I use the corresponding trading strategy that I have back tested based on those conditions. It will take months to decide if it is something I want to incorporate. This has been a pretty aggressive project and one I probably could not have done without AI. Certainly not in the timeframe I came up with and back tested it.
