One indicator I use to help determine market direction is comparing 52‑week new highs vs. new lows. Since daily counts can jump around, I smooth it by adding the total new 52‑week highs from the past five trading days and subtracting the total new 52‑week lows from those same five days.
Some traders track a weekly net total, but that can be skewed early in the week. My five‑day method gives more real‑time data without overreacting to single‑day noise. Each day I add the latest result and drop the one that’s six days old. This keeps the rolling five-day average.
This isn’t a precise timing indicator or a standalone trading plan, but it often marks important bottoms and gives an early warning when the market is primed for a pullback. In the example below, the 52‑week NH‑NL showed bearish divergences weeks before the pullbacks in October 2025 and March 2026. The indicator bottomed and reversed at the lows in November 2025 and April 2026.
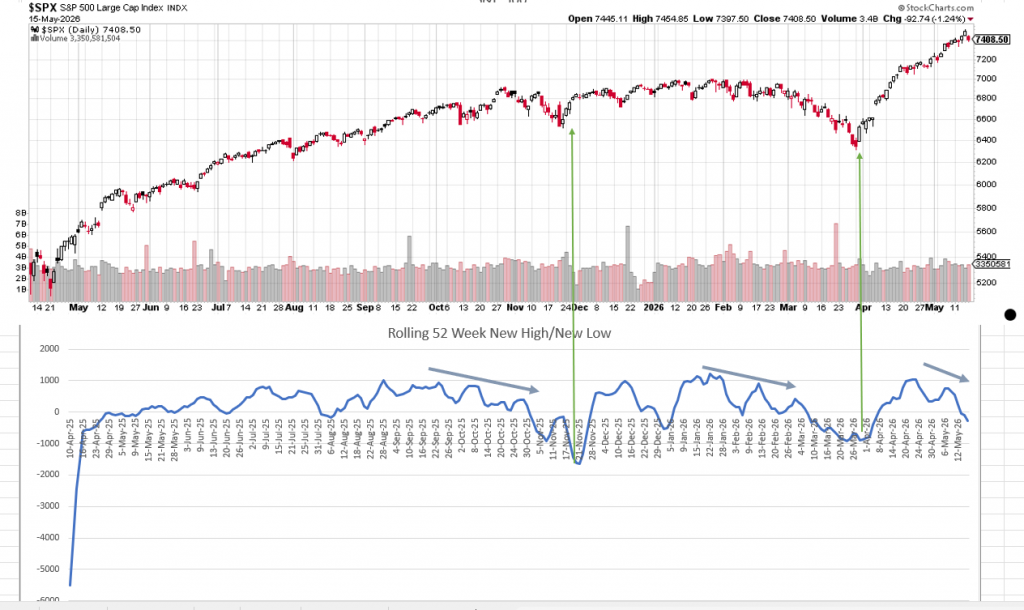
I use this tool to gauge the market’s conviction to move one way or the other — not to pick individual stocks. In simple terms, it gives me a “lay of the land.”
I pull the data from Barchart. (https://www.barchart.com/stocks/highs-lows/summary) and have the results emailed to me at the end of each trading day so I don’t miss a reading.
