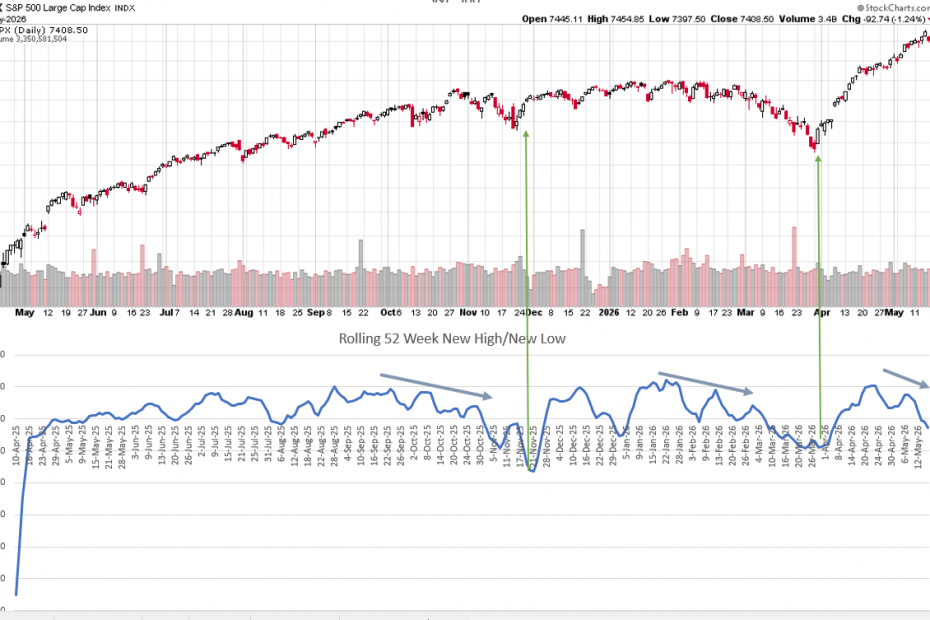
52 Week New Highs/New Lows
One indicator I use to help determine market direction is comparing 52‑week new highs vs. new lows. Since daily counts can jump around, I smooth it by adding the total new 52‑week highs from the…
One indicator I use to help determine market direction is comparing 52‑week new highs vs. new lows. Since daily counts can jump around, I smooth it by adding the total new 52‑week highs from the…
When people first look at charts, they often think it’s complicated or random. I certainly did a few years ago when I started to learn technical analysis. However, the lines from charts are often times…

This is an event that happens four times a year and is something that should be marked on the calendar if you pay regular attention to what the market is doing. The dates change every…