When people first look at charts, they often think it’s complicated or random. I certainly did a few years ago when I started to learn technical analysis. However, the lines from charts are often times far from random. One of the things I have discussed on the blog is support and resistance lines. This is a very important concept that anyone who is learning charting needs to know.
Think of Price Like Human Behavior
Markets are not driven by charts—they’re driven by people. Charts and technical analysis are used to understand the behavior.
Every price move comes from decisions:
• Someone buying
• Someone selling
• Someone hesitating
Support and resistance form because people tend to behave the same way in similar situations.
What Is Support?
Support is simply a price level where the market stops falling and starts rising.
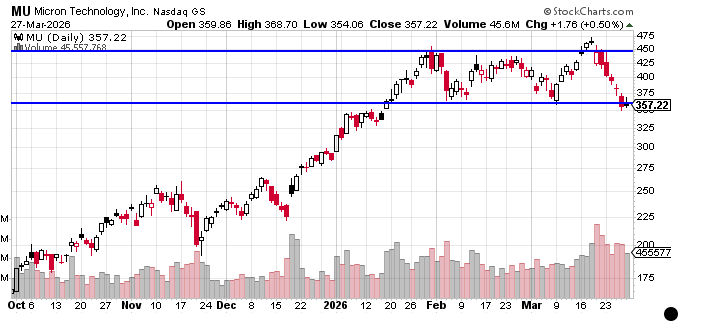
In the example above, Micron (MU) trading in a range between $350 and $450. When the stock drops to $350, buyers step in and push it back up to $450. Later, it falls again to $350 and once again, buyers step in.
After a few times, something important happens, traders begin to expect that $350 is a “good deal.”
So, when price gets there:
• Buyers are ready
• Selling slows down
• Price bounces
This has been happening since the middle of January. That’s support.
What Is Resistance?
Resistance is the opposite. It’s a price level where the market stops rising and starts falling.
In the same example above, when the stock price gets to $450, Micron hits a wall and the price begins to sink. This happens because,
• Traders think it’s expensive
• Buyers hesitate
• The market runs out of momentum
After repeated failures, traders begin to expect that price will struggle there. That’s resistance.
Why it Works.
It all comes down to human psychology. It is not a technical rule and it does not work all the time. Here is what is happening:
• Memory: Traders remember where price turned before.
• Regret:
o “I should’ve bought at $350 last time”
o “I should’ve sold at $450”
o So when price returns to those levels, they act differently.
• Crowd Behavior (Most Important)
o Thousands of traders are watching the same levels. When they act together, the market moves.
Don’t Treat Them Like Exact Lines
Support and resistance are not precise numbers. They are areas.
Price might:
• Slightly break through
• Spike past it briefly
• Reverse just before reaching it
That’s normal. Think of them like zones where decisions happen—not exact boundaries. When I trade a stock that is trading in a range, I am not looking to get the maximum profit possible by following the exact boundaries I drew. Instead, I am trying to take a portion of the middle before it reverses again.
Support and resistance are not magic. They’re not predictive tools by themselves.
They are simply a way to read behavior. As a trader, I am not trying to predict the future. Instead, traders try to understand where other traders are likely to act. That is what support and resistance levels show. The lines you see on charts are just a visual shortcut.